The World of Consumer Subscription Benchmarks
Examples around conversion, retention, renewal rates and engagement
One of the most common questions in the consumer subscription world is about metrics. However, standalone metrics are static without their counterpart benchmarks. Consumer subscription software (CSS) is an attractive sector given its high margins and recurring revenues from launch. For companies, growth is a balancing act between customer acquisition cost (CAC), retention, and unit economics. But what makes it so important to consumers?
Consumers are relying more and more on mobile apps as critical tools in their everyday lives. At the end of 2021, the Google App store had 70k apps added every month while the Apple App store had 32k apps added every month. Reliance on mobile apps will only increase with time as business models evolve from one-off purchases to ongoing subscriptions. In fact, the total spent on in-app purchases in 2021 has increased 19% YoY from $112B to $133B, with top 100 non-game subscription revenue increasing 41% YoY while the other section increased 16% YoY. In 2022, worldwide consumer spending reached $65B in H122. The Apple App Store grew 5.6% to $43.7B while the Google Play store dropped 7.4% to $21.3B.
Let’s Talk Benchmarks
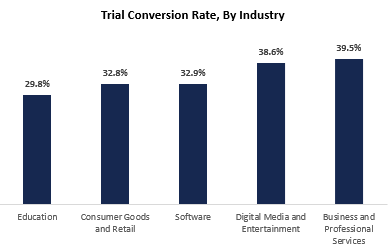
Free trials help customers make informed purchase decisions to experience products and services before committing to a recurring subscription. According to a State of Subscription Report by Recurly, ~66% of all businesses offer a free trial. Trial conversion rates explores the impact of customer acquisition and eventual conversion to a customer. At one point, Netflix boasted a best-in-class conversion rate of 93%, Amazon Prime Video at 73%, and Spotify at 46%. The median conversion rate across businesses comes out to ~32% with a breakdown by industry below.
Retention is one of the most important metrics for any business. Building a large subscriber base is difficult if your users continue to churn over time. Below is an exercise of over a dozen consumer subscription paid businesses, plotting monthly retention over a 24-month period. The blended retention median at Y1 was 40%, while Y2 was 29%. Churn in CSS is expected to be higher than traditional software-as-a-service (SaaS) companies. This brings attention towards lifetime value (LTV) vs CAC. In this analysis, the LTV/CAC median was 4x.
In a separate analysis conducted, it was found that the best consumer subscription businesses retain 65%+ of their revenue after one year. Retention above 50% is considered in the top quartile while many companies hover between 40-45%. Retention, of course, can vary based on pricing plans and the cadence of payment.
Lenny Rachitsky wrote a great blogpost titled “What is good retention”. In an excerpt from the post, I summarized some of those key metrics below. The best businesses grow significantly from existing customers as you can see under the net revenue retention exhibit – this usually would take place for SaaS focused companies. Unfortunately for CSS, there is typically very little up-sell (think about the marginal rate hikes a subscription product like Netflix or Spotify would do).
Renewal rate is one of the most important revenue metrics for a business, and ties into retention. This will often dictate whether or not the consumer is aligned with the value provided by the service and dictate the LTV associated with a customer. In an exercise conducted by RevenueCat, the company analyzed 10,000+ subscriptions apps across iOS and Android to understand how renewal rates stack up during the first three renewals. Monthly subscriptions have a median first renewal rate of 56% which increases over time, all the way to 81% on the 3rd renewal resulting in a higher LTV.
Engagement tells the story of how active users are on a ratio basis. Typical measures are DAU/MAU and DAU/WAU, measuring daily active vs monthly active and weekly actives. The best subscription businesses get to ~50% for DAU/MAU and ~60% for DAU/WAU. Engagement >35% is considered in the top quartile. At the same time, it is important to categorize engagement by vertical given the disparity of use.
For reference, these are how the top social apps rank
No one business is the same, and it is important to leverage benchmarks that are best suited to the product and category a business is serving. While quantitative benchmarks provide one lens into a company, there is also the qualitative psychological question if the product is a must have, or nice to have. As consumer discretionary spending drops (as it has), the question becomes whether or not this product is still essential.
If you are building / investing in consumer subscription or the enablement of the industry, I would love to talk and trade notes!


